Build your own Web Analytics Dashboard with Turso and Bolt

You have a database. You have data. You want to visualize that data. You could spend hours building a dashboard from scratch, or you could use Bolt to generate it for you.
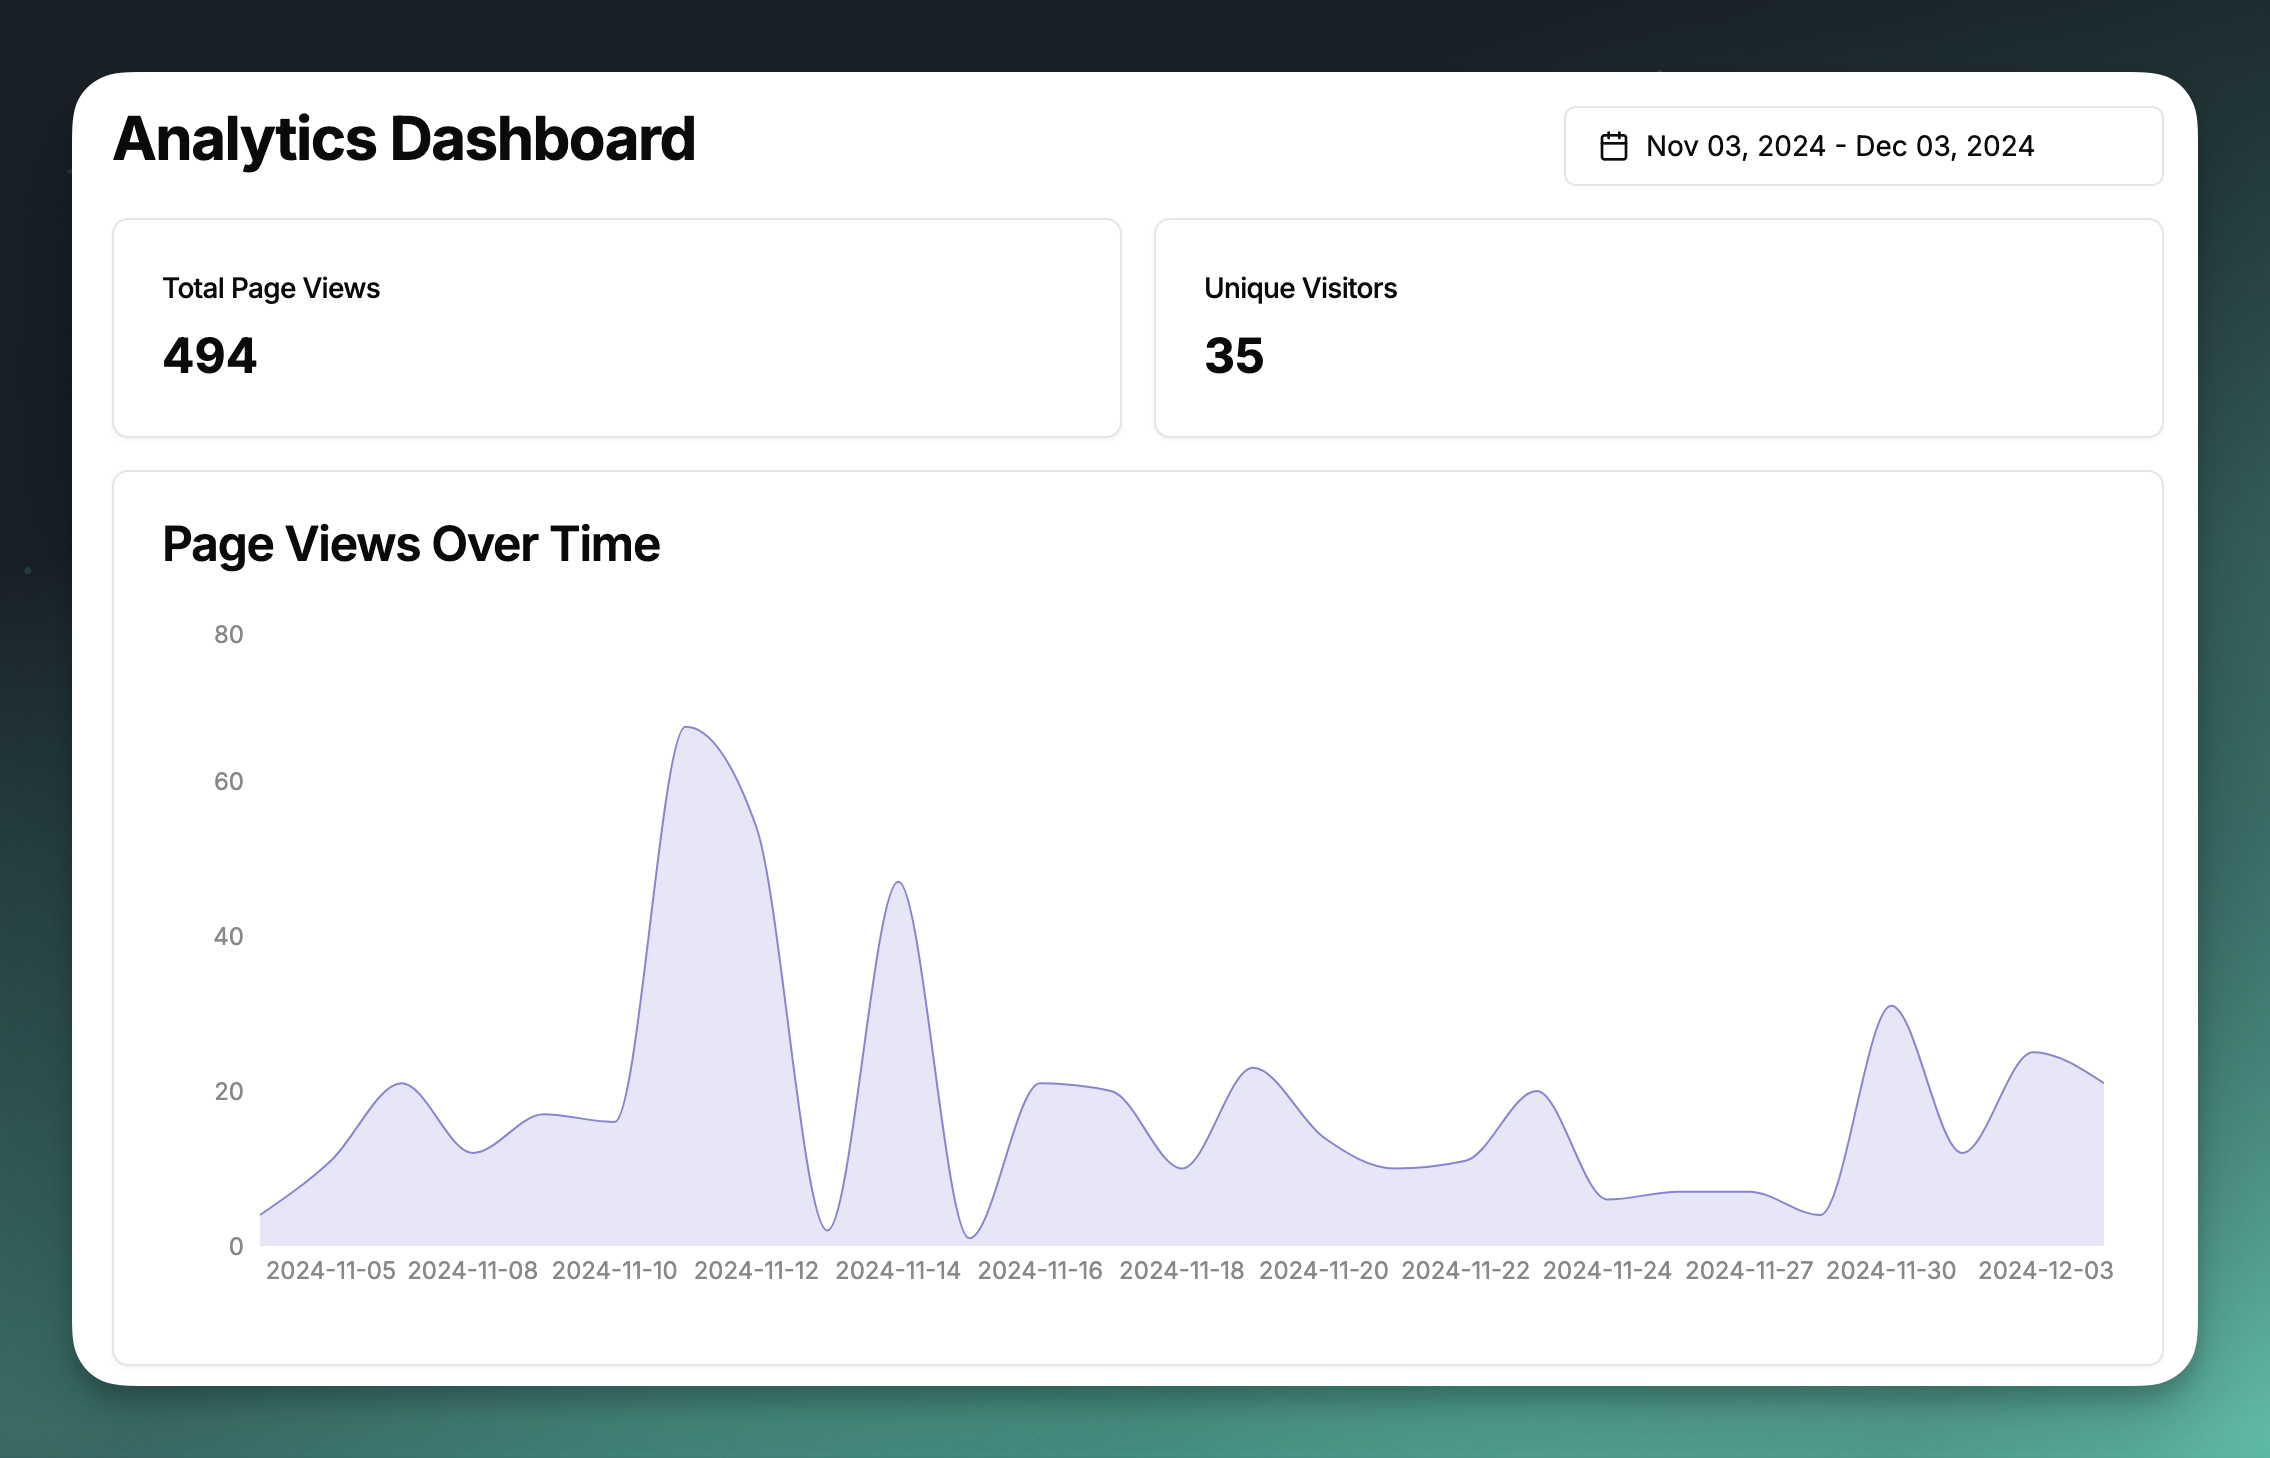
That's exactly what we're going to do in this article. We'll use Bolt to generate a web analytics dashboard that visualizes data from a Turso Database for these metrics:
- Total page views and unique visits
- Most popular pages on our site
- Top referral sources
- Geographical distribution of our visitors
- Device and browser statistics
#The Database
It's important to get the schema for the database, so we can pass it to the prompt. This will help Bolt understand the structure of the data and generate the correct queries.
You can use the Turso CLI to execute the .schema command for your database:
turso db shell <database-name> ".schema"
This will return the schema for your database, which you can then copy and paste into the prompt.
Here's the schema we will be using in this example:
CREATE TABLE pageviews (
  pageview_id TEXT PRIMARY KEY,
  session_id TEXT NOT NULL,
  visitor_id TEXT NOT NULL,
  timestamp DATETIME DEFAULT CURRENT_TIMESTAMP,
  page_url TEXT NOT NULL,
  page_title TEXT,
  referrer_url TEXT,
  FOREIGN KEY (session_id) REFERENCES sessions(session_id),
  FOREIGN KEY (visitor_id) REFERENCES visitors(visitor_id)
);

CREATE INDEX idx_pageviews_session ON pageviews(session_id);
CREATE INDEX idx_pageviews_timestamp ON pageviews(timestamp);

CREATE TABLE sessions (
  session_id TEXT PRIMARY KEY,
  visitor_id TEXT NOT NULL,
  started_at DATETIME DEFAULT CURRENT_TIMESTAMP,
  ended_at DATETIME DEFAULT CURRENT_TIMESTAMP,
  device TEXT,           -- e.g. "iPhone" or "Chrome on Windows"
  browser TEXT,          -- e.g. "Chrome 120.0"
  os TEXT,              -- e.g. "Windows 11"
  country_code TEXT,     -- e.g. "US"
  country_name TEXT,     -- e.g. "United States"
  language TEXT,         -- e.g. "en-US"
  FOREIGN KEY (visitor_id) REFERENCES visitors(visitor_id)
);

CREATE INDEX idx_sessions_visitor ON sessions(visitor_id);
CREATE TABLE visitors (
  visitor_id TEXT PRIMARY KEY,
  first_seen_at DATETIME DEFAULT CURRENT_TIMESTAMP,
  last_seen_at DATETIME DEFAULT CURRENT_TIMESTAMP
);

CREATE INDEX idx_visitors_last_seen ON visitors(last_seen_at);
#The Prompt
It all starts with a prompt:
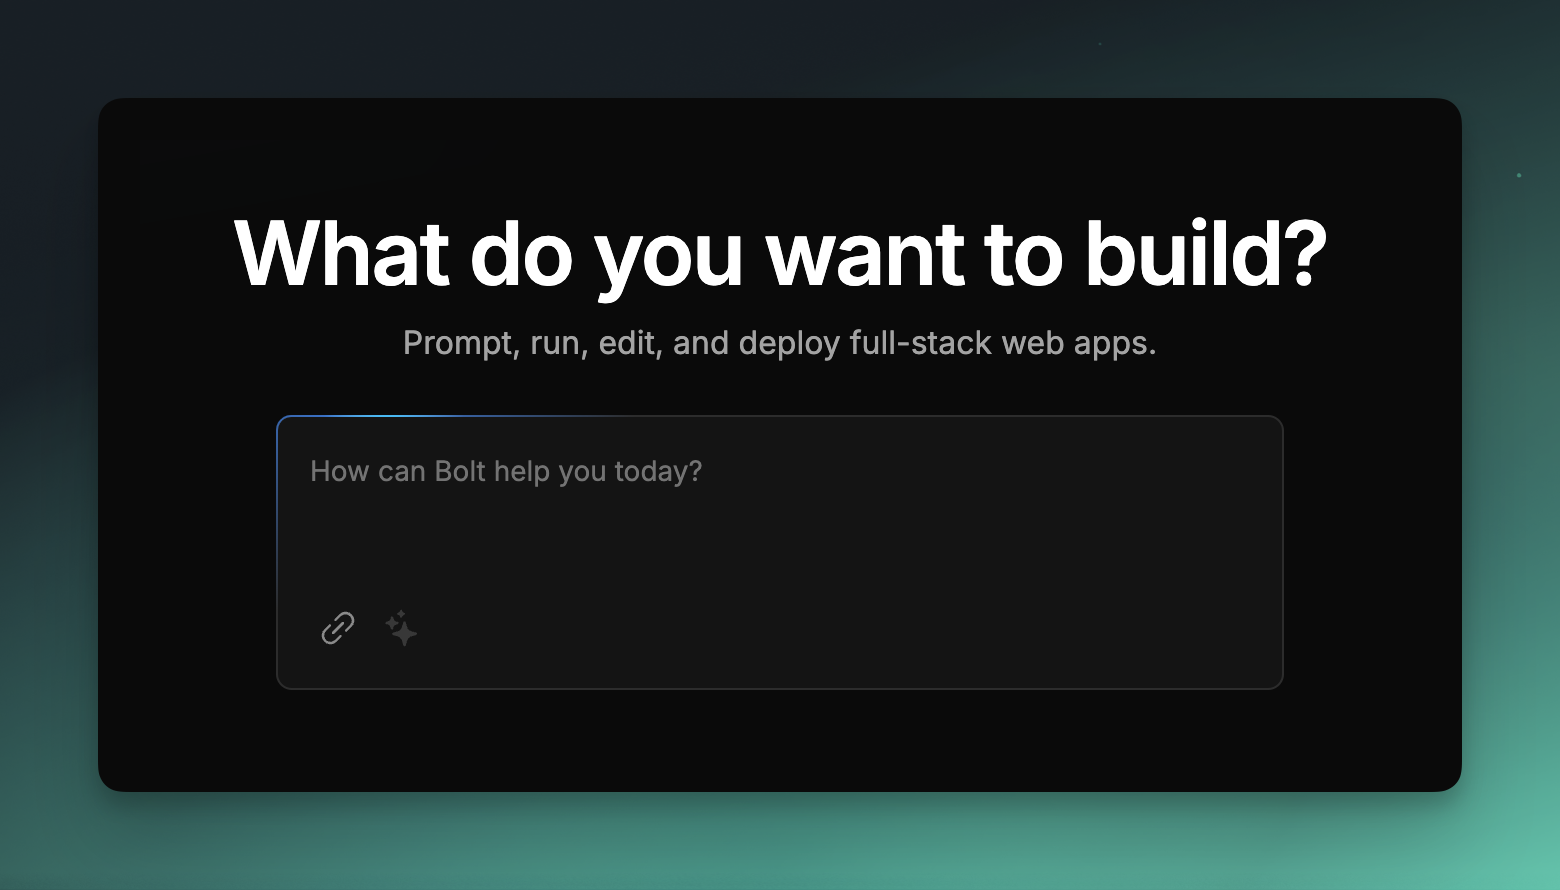
Having a clear, concise and detailed prompt is crucial for Bolt to generate the correct code for your project.
Below is the prompt we use:
Create a modern analytics dashboard using Next.js 14 with App Router. The dashboard should display web analytics data from a Turso database with the following schema:

[INSERT SCHEMA FROM ABOVE HERE]

Requirements:
1. Use the latest libsql-stateless-easy@1.8.0 for database connections
2. Create a responsive layout with a clean, modern design
3. Include the following components:
   - Overview card showing total page views and unique visits
   - Line chart showing daily page views trend
   - Top pages table with view counts
   - List of top referrers, countries, and device distribution
4. Add date range filtering for all metrics
5. Use shadcn/ui for the UI components
6. Include loading states and error handling
7. Make all components server-side rendered where possible
8. Use "use client" for client components that use any React state or effect hooks

The dashboard should focus on presenting clear, actionable insights from the analytics data.
This prompt includes the requirements for the dashboard, such as the components to include, the design, and the libraries to use.
You will need to make sure to edit the .env file with your Database URL and Auth Token. Here is my URL and read only token if you're following along:
TURSO_DB_URL=https://boltanalytics-notrab.turso.io
TURSO_DB_AUTH_TOKEN=eyJhbGciOiJFZERTQSIsInR5cCI6IkpXVCJ9.eyJhIjoicm8iLCJpYXQiOjE3MzMyMzIxODAsImlkIjoiZTY2MTU5ZGUtZDMyNi00NWE3LTllN2QtMDc1OTQ0NzA3YzAyIn0.bhqW8VAerr9COm3WpJVx7OJMTr5r9Hm_GEHwBo7vdXpi-peb63CLBbxO4f_gUwf1CJR3UpWAJcr07TjCSefYCg
Make sure the environment variable names match the ones Bolt generated for you in the .env file.
#The Result
Once the prompt has completed, you will have a StackBlitz editor with your code, and the application will be running in the preview window.
Bolt did a pretty good job creating the Web Analytics Dashboard with the requirements we provided:
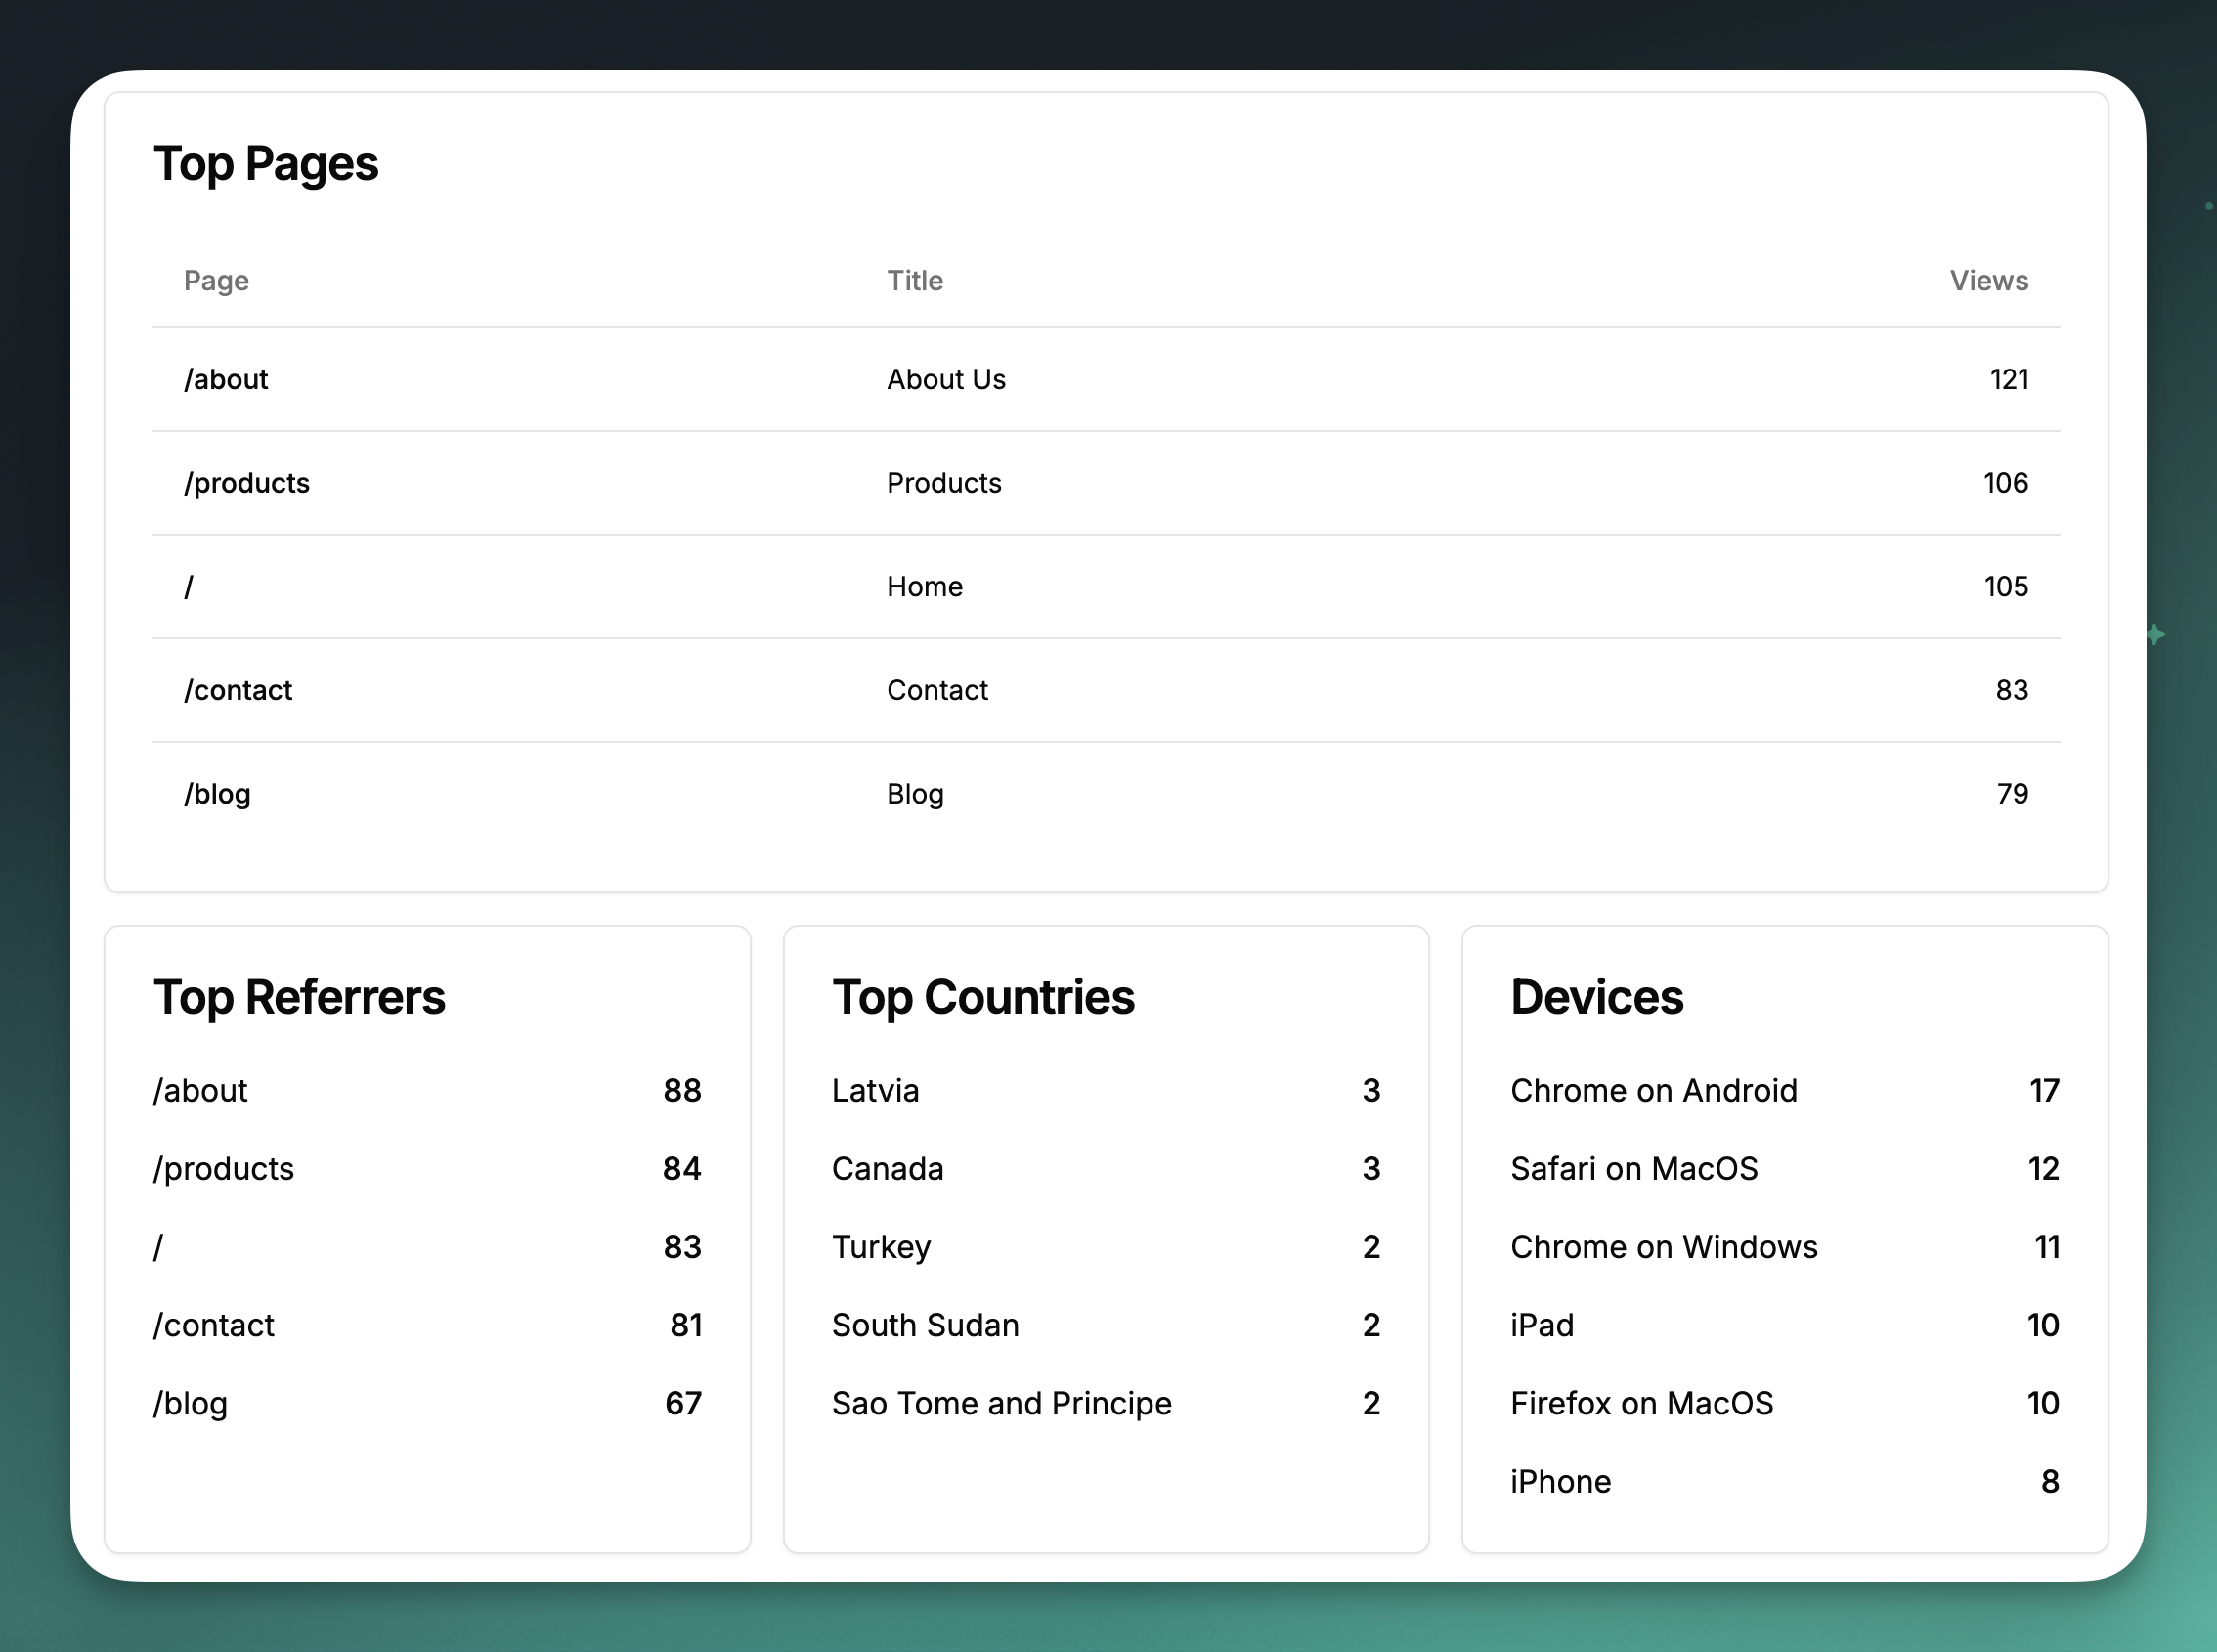
Bolt also included other important metrics for Top Pages, Referrers, Countries, and Devices:
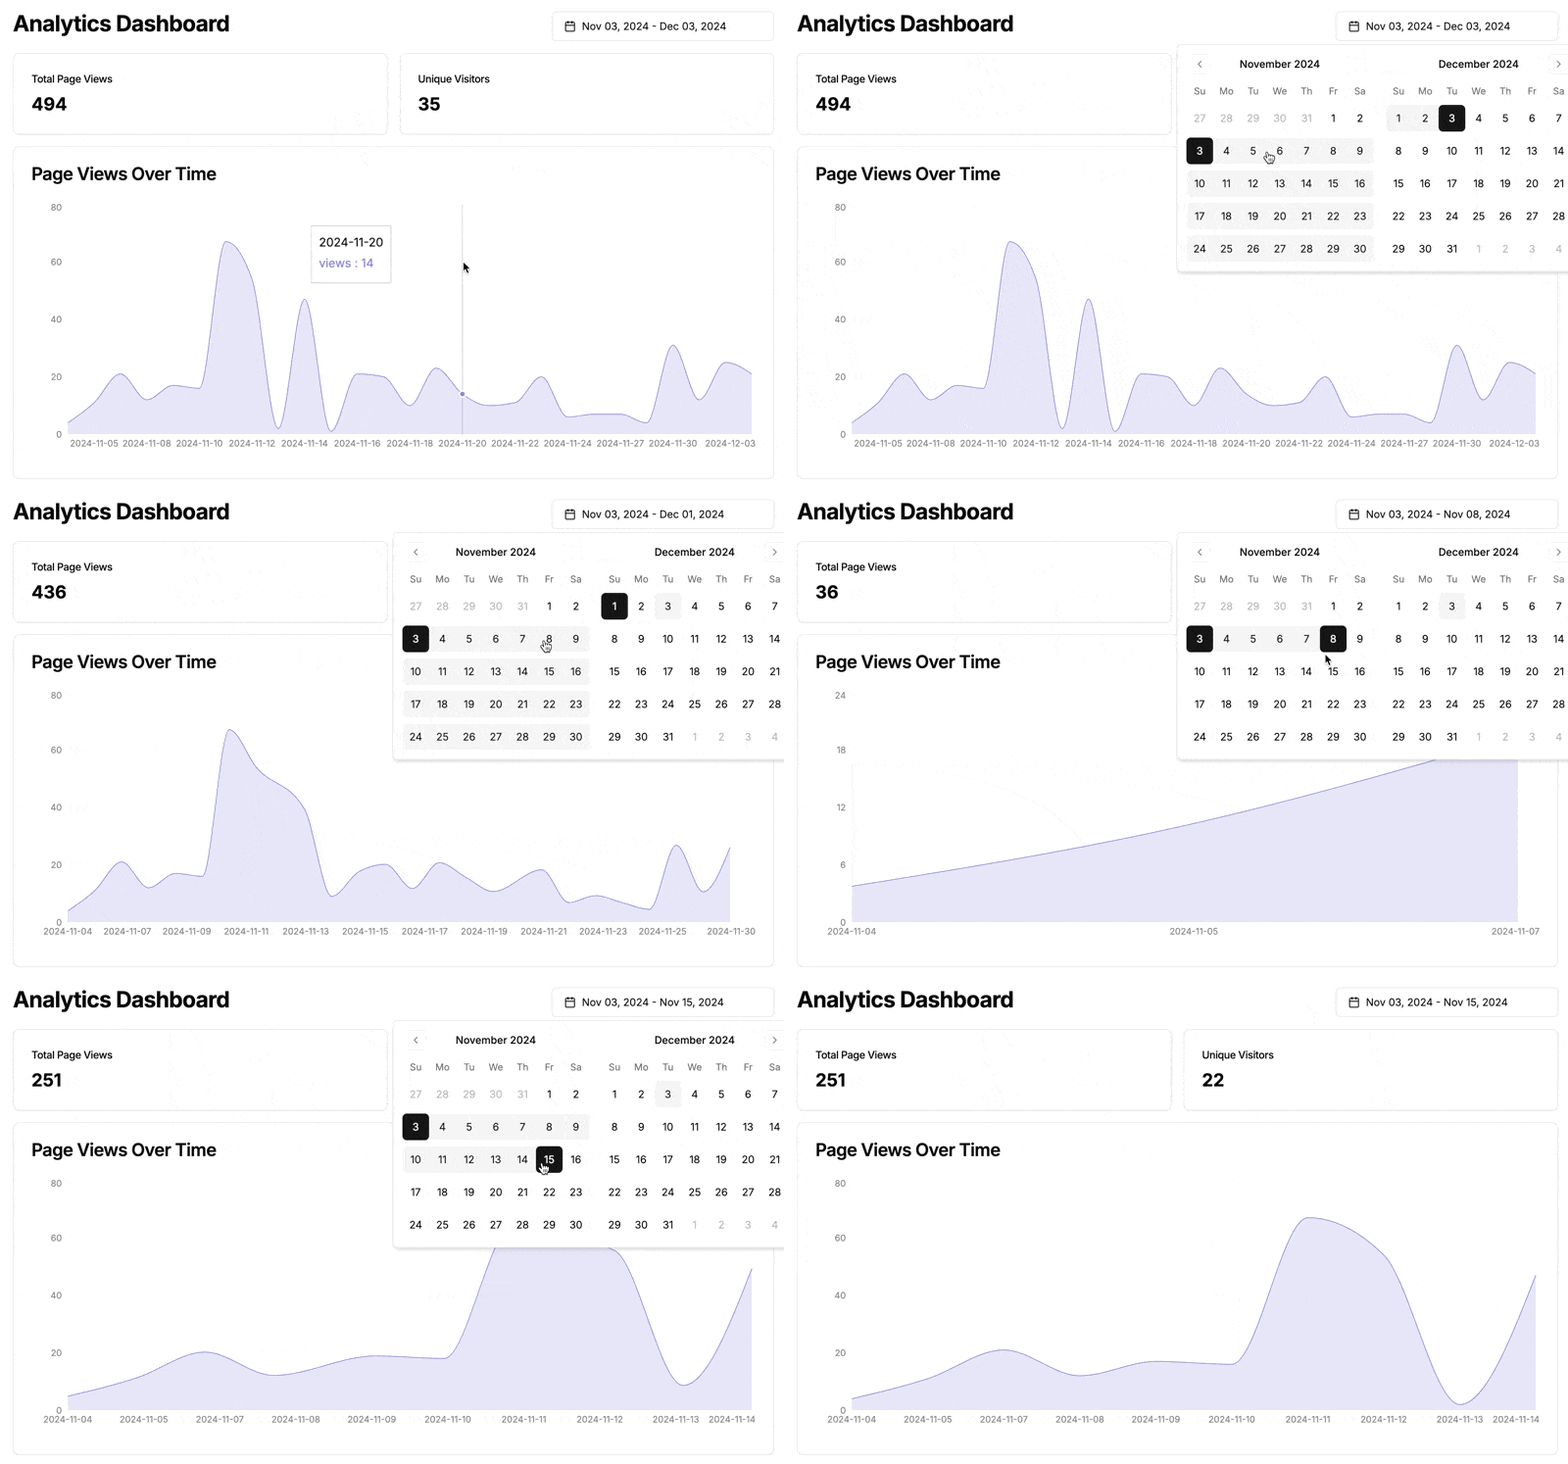
Bolt also included a date picker so I can select the exact date range I want to analyze:
#Iterate with Bolt
The fun doesn't stop here. You can continue to chat with Bolt to iterate on the design, add new features, or fix any issues you encounter.
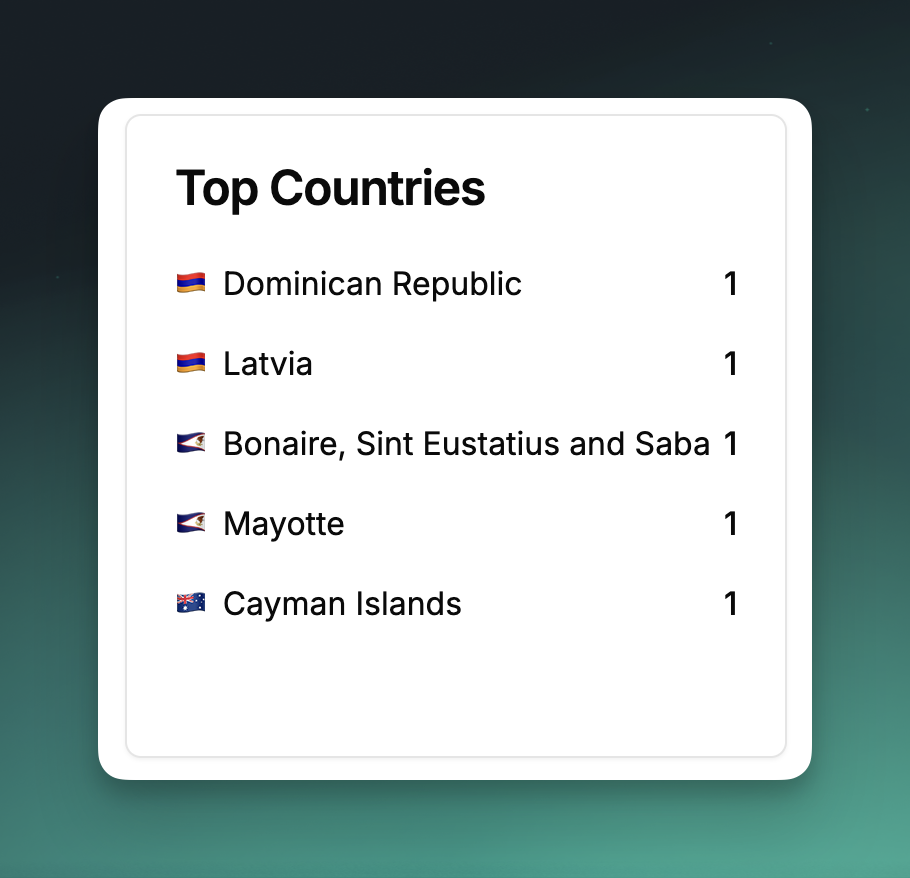
The Top Countries would look way nicer if they had each flag next to them, so let's ask Bolt!
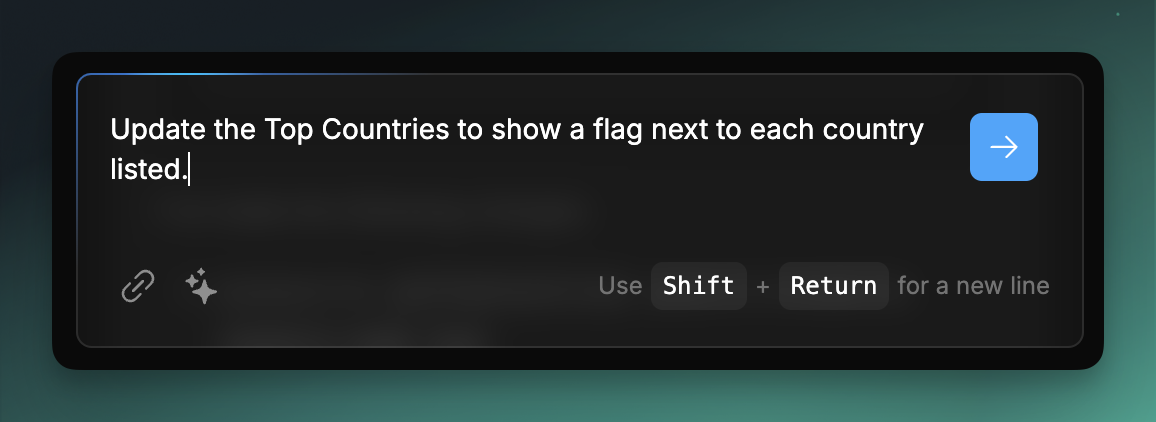
Bolt will generate the code for you to add the flags to the top countries list:
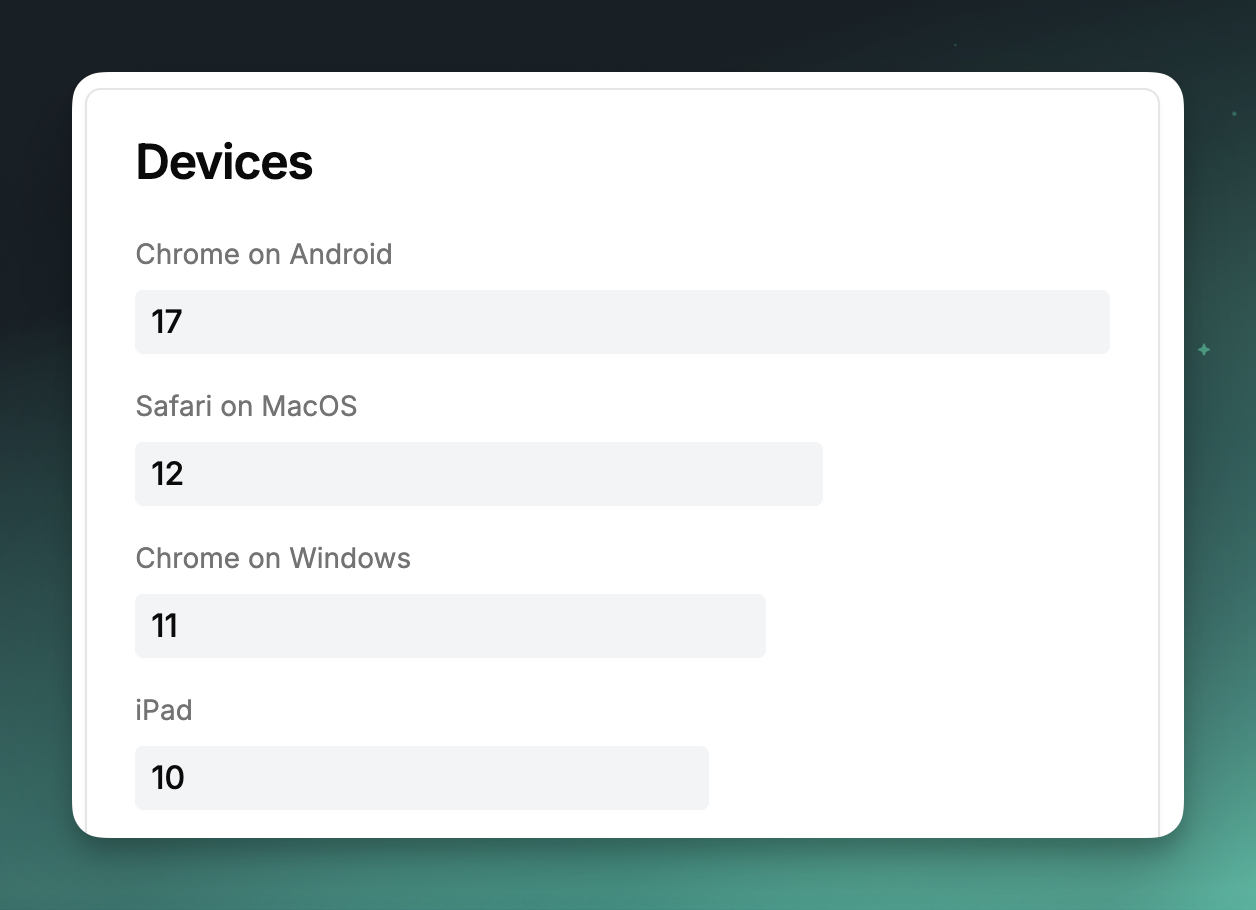
As I continue to iterate with prompts, I can modify any parts of the UI I don't like, or think could be improved — such as adding a custom background style to better represent devices:
#Challenges
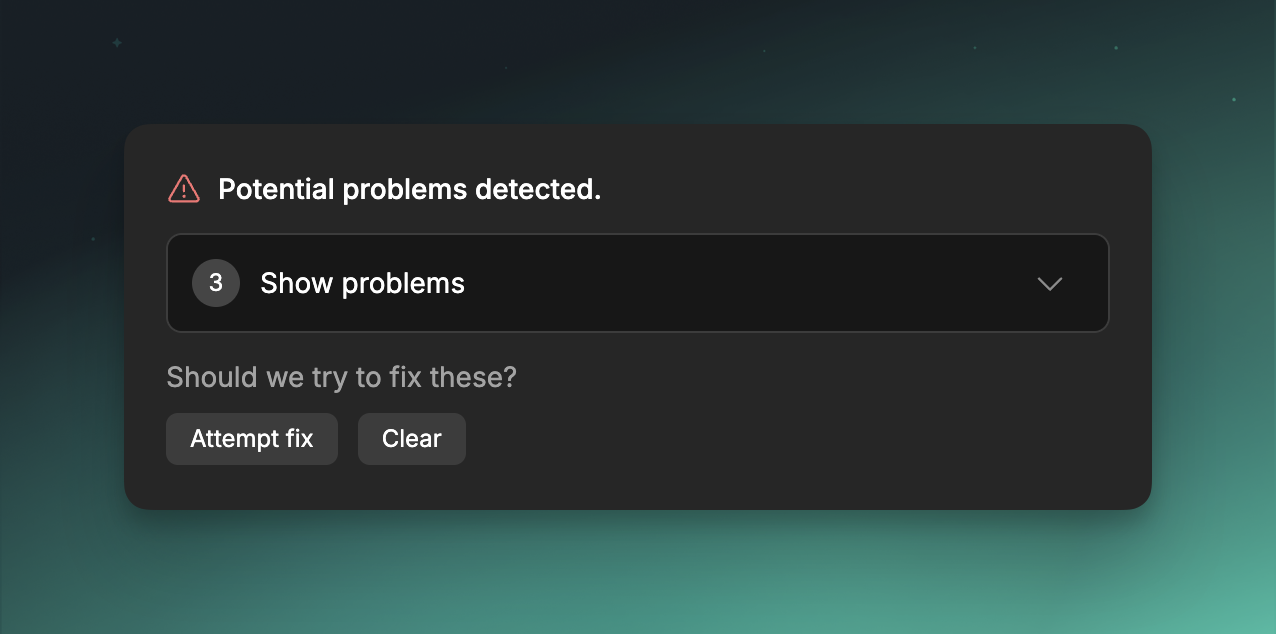
There will be times you run into problems that you need to solve. Bolt can attempt to automatically fix them for you, and if it can't, you can prompt the AI a bit more information — such as instructions from a frameworks latest documentation.
#Conclusion
Getting started is always the hardest stage of any new project, but Bolt makes it incredible difficult to procrastinate.
Turso makes it super easy to create one or more databases that you can use for your next Bolt project — get started for free.